RRDtool is a graphing utility made by Tobi Oetiker and released under the terms of the GNU General Public License (GPL). It is simply a program that takes data sets you collect and graphs them. RRDtool (acronym for round-robin database tool) correlates time-series data like network bandwidth, temperatures, CPU load or any other data type. Data is stored in a round-robin database (circular buffer) which allows the system storage footprint to remain constant over time. The database will always have the same amount of data points throughout its lifetime. When new data comes in the oldest data set is removed (FIFO).
The back end of many popular graphing programs like Cacti, SmokePing, MRTG, Nagios, Zenoss, collectd, Astaro, Nmon and others are based on RRDtool. If you would prefer to make your own solution learning RRDtool is the way to go.
There are three(3) basic steps to setting up RRDtool and graphing your data sets. All of our examples use the same three steps.
Please make note that the syntax of rrdtool changes with the package version. We highly suggest using RRDtool v1.2.x which require very few dependancies compared to v1.4.x. To install rrdtool on OpenBSD, use "pkg_add -i rrdtool". For FreeBSD 9.x and 10.x use "portmaster databases/rrdtool12" or "pkg install rrdtool-1.2.30_2".
The "Ping an IP and graph it" tutorial is going to be our detailed introductory example. At each step we will explain what RRDtool is doing and what our script for that stage is trying to do. Since every machine has the ping binary you should be able to get this example working with minimal effort and, when you are ready, progress to the more involved examples further down on the page.
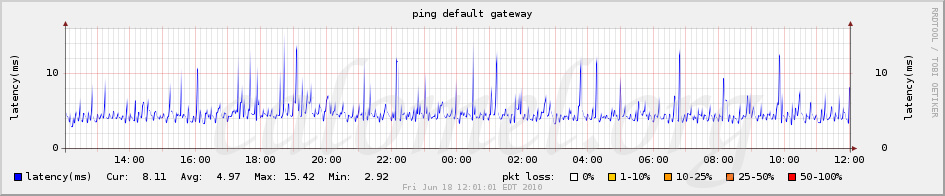
Explaining the graph. The graph shows both the round trip time (rtt) and packet loss (pl). The rtt is graphed in blue. The packet loss is the background area color of the graph over the time frame the loss was experienced. If there is _no_ packet loss then the background is white like the example. If there is packet loss then the background will shade from yellow to red depending on the severity of loss. We are graphing 24 hours of data at a 1 minute granularity and the times are on the x-axis on the bottom. The y-axis is automatically scaled depending on the data collected and shows the latency in milliseconds (ms); the y-axis legend is printed on the left and the right sides. The title is in black at the top and at the bottom in a watermark (light gray) is the date and time the graph was created. When reading the graph remember that new data is on the right and the oldest data is on the left.
Working directory. We will being putting all of the files into a working directory we made up called, "/tools/rrdtool/latency/". This is where the three(3) scripts, the database and the graph will reside. Once the graph is made it can be copied to a web directory like, "/var/www/htdocs/" for easy viewing through our web server.
To use RRDtool you must first initialize the database. This script will make a rrd database called "latency_db.rrd". This is the file that will be updated and hold all of your data. This step is only done once.
The following scrollable window contains the command we used to make the rrd file. Cut and paste the script into a file called, "initialize_database.sh" and make it executable with "chmod 755 update_rrd_database.sh". The rrdtool lines in the file are one command, but we have put line breaks ( \ is a line break ) in to create multiple lines so it is easier to read and explain.
user@machine# cat initialize_database.sh

### change to the script directory
cd /tools/rrdtool/latency/

rrdtool create latency_db.rrd \
--step 60 \
DS:pl:GAUGE:120:0:100 \
DS:rtt:GAUGE:120:0:10000000 \
RRA:MAX:0.5:1:1500 \
rrdtool create latency_db.rrd -- here we are calling the rrdtool binary and telling it to "create" the rdd database we have named "latency_db.rrd". This file is created in the current working directory.
--step 60 -- is the amount of time in seconds we expect data to be updated into the database. You will see later that our update script is going to update the database with the results of the ping command every 60 seconds using a cron job.
DS:pl:GAUGE:120:0:100 -- This is our first variable and each option is a colon separated value. Lets take a look at each option.
DS:rtt:GAUGE:120:0:10000000 -- This is our second variable and each option is a colon separated value.
RRA:MAX:0.5:1:1500 -- this is the round robin archive directive. Each option is a colon separated value.
Now that we have made the database we need to fill it with data. you can write any type of script you want for this purpose. This is a simple shell script which will ping a host, collect the data from the ping output and enter the pl and rtt into our database called latency_db.rrd. Cut and paste the example into a file called, "update_rrd_database.sh" and make it executable with "chmod 755 update_rrd_database.sh".
The "update_rrd_database.sh" script will change to the working directory, "/tools/rrdtool/latency/". Then, the get_data method will run and ping the ip defined in the hosttoping variable; gawk is used to separate out the data and collect it using regular expressions. The last line to run will update the latency_db.rrd database with the pl and rtt values in order and separated by a colon.
NOTE: before using this script make sure you set the proper paths of the variables at the top of the script. These paths are for OpenBSD and Linux is slightly different. Update the paths for bash, ping, gwak and rrdtool. The reason we use full paths is because CRON may not be setup with the full path environment. Also, if you do not have gawk it can be easily installed using the package manager (apt-get, yum, pkg_add) of your choice in most *nix os's. Finally, the variable "hosttoping" should contain the ip address or hostname of the machine we want to ping. For this example 192.168.0.1 will be a machine we consider to be our default gateway on our network.
user@machine# cat update_rrd_database.sh

#!/usr/local/bin/bash
#
### set the paths
command="/sbin/ping -q -n -c 3"
gawk="/usr/local/bin/gawk"
rrdtool="/usr/local/bin/rrdtool"
hosttoping="192.168.0.1"

### data collection routine
get_data() {
    local output=$($command $1 2>&1)
    local method=$(echo "$output" | $gawk '
        BEGIN {pl=100; rtt=0.1}
        /packets transmitted/ {
            match($0, /([0-9]+)% packet loss/, datapl)
            pl=datapl[1]
        }
        /min\/avg\/max/ {
            match($4, /(.*)\/(.*)\/(.*)\/(.*)/, datartt)
            rtt=datartt[2]
        }
        END {print pl ":" rtt}
        ')
    RETURN_DATA=$method
}

### change to the script directory
cd /tools/rrdtool/latency/

### collect the data
get_data $hosttoping

### update the database
$rrdtool update latency_db.rrd --template pl:rtt N:$RETURN_DATA
The best way to collect the data is to run a cron job every minute. We set the step to 60 in the initialization of the database and we will update the database every 60 seconds using a cron job.
user@machine# crontab -e
#minute (0-59)
#|   hour (0-23)
#|   |     day of the month (1-31)
#|   |     |    month of the year (1-12)
#|   |     |    |   day of the week (0-6 with 0=Sun)
#|   |     |    |   |   commands
#|   |     |    |   |   |
#### rrdtool ping statistics
*    *     *    *   *   /tools/rrdtool/latency/update_rrd_database.sh
After you have the cron job running for ten minutes or so you should have enough data to see on the graph.
Copy and paste the following script we call "create_graph.sh" and make it executable with "chmod 755 create_graph.sh".
user@machine# cat create_graph.sh

#!/usr/local/bin/bash
#
## change directory to the rrdtool script dir
cd /tools/rrdtool/latency/

## Graph for last 24 hours
/usr/local/bin/rrdtool graph latency_graph.png \
-w 785 -h 120 -a PNG \
--slope-mode \
--start -86400 --end now \
--font DEFAULT:7: \
--title "ping default gateway" \
--watermark "`date`" \
--vertical-label "latency(ms)" \
--right-axis-label "latency(ms)" \
--lower-limit 0 \
--right-axis 1:0 \
--x-grid MINUTE:10:HOUR:1:MINUTE:120:0:%R \
--alt-y-grid --rigid \
DEF:roundtrip=latency_db.rrd:rtt:MAX \
DEF:packetloss=latency_db.rrd:pl:MAX \
CDEF:PLNone=packetloss,0,0,LIMIT,UN,UNKN,INF,IF \
CDEF:PL10=packetloss,1,10,LIMIT,UN,UNKN,INF,IF \
CDEF:PL25=packetloss,10,25,LIMIT,UN,UNKN,INF,IF \
CDEF:PL50=packetloss,25,50,LIMIT,UN,UNKN,INF,IF \
CDEF:PL100=packetloss,50,100,LIMIT,UN,UNKN,INF,IF \
LINE1:roundtrip#0000FF:"latency(ms)" \
GPRINT:roundtrip:LAST:"Cur\: %5.2lf" \
GPRINT:roundtrip:AVERAGE:"Avg\: %5.2lf" \
GPRINT:roundtrip:MAX:"Max\: %5.2lf" \
GPRINT:roundtrip:MIN:"Min\: %5.2lf\t\t\t" \
COMMENT:"pkt loss\:" \
AREA:PLNone#FFFFFF:"0%":STACK \
AREA:PL10#FFFF00:"1-10%":STACK \
AREA:PL25#FFCC00:"10-25%":STACK \
AREA:PL50#FF8000:"25-50%":STACK \
AREA:PL100#FF0000:"50-100%":STACK

## copy to the web directory
cp latency_graph.png /var/www/htdocs/
rrdtool graph latency_graph.png -- This tells rrdtool to create a graph called "latency_graph.png". This file is created in the current working directory.
-w 785 -h 120 -a PNG -- this creates a graph 785 pixels wide and 120 pixels high with the PNG extension format. Portable Network Graphics (PNG) is a bitmapped image format that employs lossless data compression. PNG files nearly always use file extension "PNG" or "png" and are assigned MIME media type "image/png". Note the width and height define the graph size and not the size of the entire picture.
--slope-mode -- says rrdtool should smooth the graph and create a more organic looking lines. This option uses anti-aliasing and gives the graphs a smooth hand drawn look. Using slope also creates the faded sharp lines in the peaks of the graph.
--start -86400 --end now -- specifies the time in the past in seconds up to now to graph. 86400 seconds is 24 hours. So, we are graphing data from 24 hours ago up to when the graph was created. Since we have 25 hours of data in our database this should work fine.
--font DEFAULT:7: -- is the default font for all the text on the graph. The default is 8 point on most systems. We thought 7 point looks a little cleaner and less crowded.
--title "ping default gateway" -- the title in black seen at the top center of the picture.
--watermark "`date`" -- the light gray date seen at the bottom center of the picture. We decided the creation date was a useful.
--vertical-label "latency(ms)" and --right-axis-label "latency(ms)" -- sets the vertical text on the left and right side of the graph. Though this graph does not need the text on the right it makes the picture more symmetrical and lines up with dual graphed y-axis seen later on this page. For example, the pfstat graphs all line up vertically and this graph is the same width. When all of your pictures use the same width and scale you are easily able to see patturns by looking at one vertical plane through all the graphs.
--lower-limit 0 -- sets the y-axis numbers so they are clean a more readable. The lower limit is forced to be 0 as none of our data (rtt) should ever be negative.
--right-axis 1:0 -- is the ratio between the value on the left axis (parent) and the right axis (child). We are using the same scale on the left and right so we set the ratio to 1, which stands for 1:1. The last 0 is used to add a value to the right axis.
--x-grid MINUTE:10:HOUR:1:MINUTE:120:0:%R -- rescales the x-axis in the graph and places the time labels below the graph.
--alt-y-grid --rigid -- sets the y-axis numbers so they are clean a more readable.
DEF:roundtrip=latency_db.rrd:rtt:MAX -- DEF stands for definition. We will use this line to define a variable from the database to a variable we will use to graph. Though this is not really useful in this example, it is very useful if you have multiple databases. Lets say you have two databases, one for external and the other for internal traffic, and both have a variable called "ping". You could define the "ping" from database one to be "ping_external" and the other to be "ping_internal". Both DEF directives are very similar so we will cover the first for this example. Lets take a look at each option.
CDEF:PLNone=packetloss,0,0,LIMIT,UN,UNKN,INF,IF -- This CDEF line will look for a packetloss value equal to 0% and up to 0% and set the value from 0 to infinite (i.e. the top of the graph). This method is useful to see the background efficiently. Both CDEF directives are very similar so we will cover the first for this example. Lets take a look at each option.
LINE1:roundtrip#0000FF:"latency(ms)" -- this is the first line to create a legend value and draw a line.
GPRINT:roundtrip:LAST:"Cur\: %5.2lf" -- GPRINT is used to print to the legend. It will do a calculation using only the data that is in the current graph. This is very useful if you want to see the minimum and maximum values for a certain time frame and not all the values in the database. The GPRINT values used here print out the current, average, maximum and minimum round trip (rtt) times according to the current graphed data set.
COMMENT:"pkt loss\:" -- comments can be added to the legend using this directive.
AREA:PLNone#FFFFFF:"0%":STACK -- This is very similar to the LINE1 directive above. The AREA directive colors between a range of values.
/t and /n -- are tabs and new line characters. We use these in the create_graph.sh script to properly format the legend at the bottom of the picture. In the very newest versions of RRDTool they have included the "/u" command. This means go back up one line. Most RRDtool installs are old so we have used tabs and new lines to be backwards compatable.
Adding the create_graph.sh script as the second line to the cron job will now collect the data and create a graph. This example will continue to collect data every minute. The create_graph.sh script will run on the 1st and 31st minute of the hour between the hours of 10am and 10pm (22:00).
user@machine# crontab -e
#minute (0-59)
#|   hour (0-23)
#|   |     day of the month (1-31)
#|   |     |    month of the year (1-12)
#|   |     |    |   day of the week (0-6 with 0=Sun)
#|   |     |    |   |   commands
#|   |     |    |   |   |
#### rrdtool latency check
*    *     *    *   *   /tools/rrdtool/latency/update_rrd_database.sh
1,31 10-22 *    *   *   /tools/rrdtool/latency/create_graph.sh >> /dev/null 2>&1
This our example of using RRDtool to replace the package Pfstat. Once you learn to make your own graphs you can customize them to your specifications.
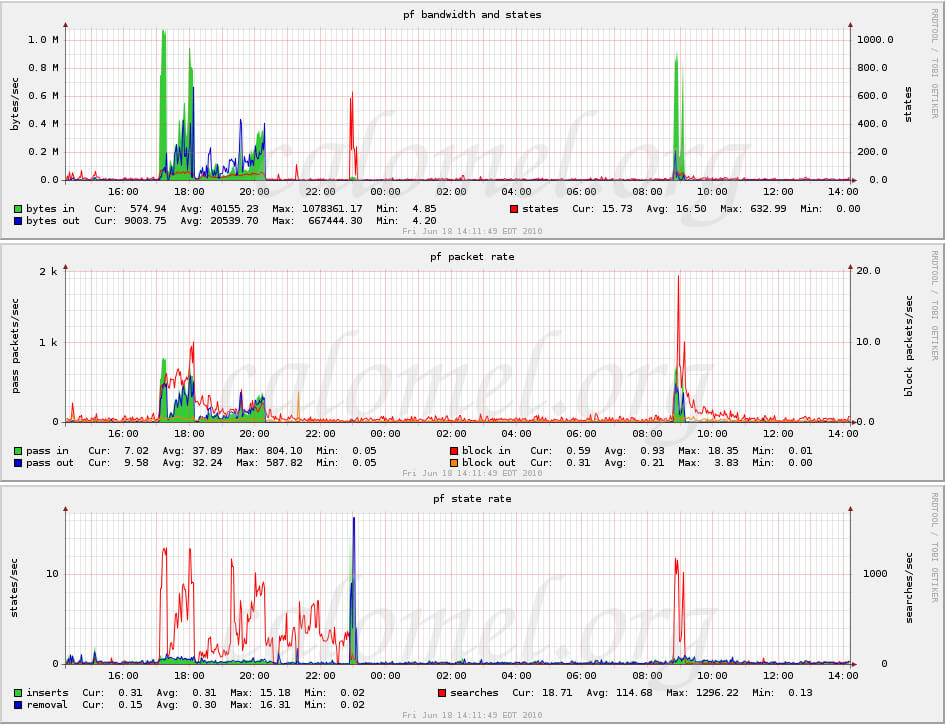
Explaining the graphs. The example picture shows 3 graphs in total, but they are used together to see patterns in Pf. The top graph shows the bandwidth in bytes per second on the left side and total states per second on the right. The second graph displays the packet rate. We have packets passed in and out per second on the left and packets which are blocked in and out on the right.The third graph is for pf states. Inserts and removal per second are graphed on the left and searches of the state table per second on the right. The title is in black at the top and at the bottom in a watermark (light gray) is the date and time the graph was created. When reading the graph remember that new data is on the right and the oldest data is on the left. The "calomel.org" watermark is not part of rrdtool and just used to identify our site.
All three graphs are used together to see the relationship between bandwidth and packet rate as it relates to state searches for example.
Working directory. We will being putting all of the files into a working directory we made up called, "/tools/rrdtool/pf_stats/". This is where the three(3) scripts, the database and the three(3) graphs will reside. Once the graph is made it can be copied to a web directory like, "/var/www/htdocs/".
The following scrollable window contains the command we used to make the rrd file. Cut and paste the script into a file called, "initialize_database.sh" and make it executable with "chmod 755 update_rrd_database.sh". The rrdtool lines in the file are one command, but we have put line breaks ( \ is a line break ) in to create multiple lines so it is easier to read and explain.
user@machine# cat initialize_database.sh

## change directory to the rrdtool script dir
cd /tools/rrdtool/pf_stats/

rrdtool create pf_stats_db.rrd \
--step 60 \
DS:BytesIn:COUNTER:120:0:10000000000000 \
DS:BytesOut:COUNTER:120:0:10000000000000 \
DS:PktsInPass:COUNTER:120:0:10000000000000 \
DS:PktsInBlock:COUNTER:120:0:10000000000000 \
DS:PktsOutPass:COUNTER:120:0:10000000000000 \
DS:PktsOutBlock:COUNTER:120:0:10000000000000 \
DS:States:GAUGE:120:0:10000000000000 \
DS:StateSearchs:COUNTER:120:0:10000000000000 \
DS:StateInserts:COUNTER:120:0:10000000000000 \
DS:StateRemovals:COUNTER:120:0:10000000000000 \
RRA:MAX:0.5:1:1500
This is a shell script to collect the data from the "pfctl -si" command. Before using this script make sure the paths at the top of the script match the paths on your system. These paths are for the latest release of OpenBSD.
user@machine# cat update_rrd_database.sh

#!/usr/local/bin/bash

gawk="/usr/local/bin/gawk"
pfctl="/sbin/pfctl"
rrdtool="/usr/local/bin/rrdtool"

pfctl_info() {
    local output=$($pfctl -si 2>&1)
    local temp=$(echo "$output" | $gawk '
        BEGIN {BytesIn=0; BytesOut=0; PktsInPass=0; PktsInBlock=0; \
               PktsOutPass=0; PktsOutBlock=0; States=0; StateSearchs=0; \
               StateInserts=0; StateRemovals=0}
        /Bytes In/ { BytesIn = $3 }
        /Bytes Out/ { BytesOut = $3 }
        /Packets In/ { getline;PktsInPass = $2 }
        /Passed/ { getline;PktsInBlock = $2 }
        /Packets Out/ { getline;PktsOutPass = $2 }
        /Passed/ { getline;PktsOutBlock = $2 }
        /current entries/ { States = $3 }
        /searches/ { StateSearchs = $2 }
        /inserts/ { StateInserts = $2 }
        /removals/ { StateRemovals = $2 }
        END {print BytesIn ":" BytesOut ":" PktsInPass ":" \
             PktsInBlock ":" PktsOutPass ":" PktsOutBlock ":" \
             States ":" StateSearchs ":" StateInserts ":" StateRemovals}
        ')
    RETURN_VALUE=$temp
}

### change to the script directory
cd /tools/rrdtool/pf_stats/

### collect the data
pfctl_info

### update the database
$rrdtool update pf_stats_db.rrd --template BytesIn:BytesOut:PktsInPass:PktsInBlock:PktsOutPass:PktsOutBlock:States:StateSearchs:StateInserts:StateRemovals N:$RETURN_VALUE
After you have the cron job running for ten minutes or so you should have enough data to see on the graphs. A cron job example is at the bottom of this example. Copy and paste the following script we call "create_graph.sh" and make it executable with "chmod 755 create_graph.sh".
user@machine# cat create_graph.sh

### change to the script directory
cd /tools/rrdtool/pf_stats/

######
######## pf bandwidth and states graph
/usr/local/bin/rrdtool graph pf_stats_bytes_states.png \
-w 785 -h 151 -a PNG \
--slope-mode \
--start end-86400 --end now \
--font DEFAULT:7: \
--title "pf bandwidth and states" \
--watermark "`date`" \
--vertical-label "bytes/sec" \
--right-axis-label "states" \
--right-axis 0.001:0 \
--x-grid MINUTE:10:HOUR:1:MINUTE:120:0:%R \
--alt-y-grid --rigid \
DEF:BytesIn=pf_stats_db.rrd:BytesIn:MAX \
DEF:BytesOut=pf_stats_db.rrd:BytesOut:MAX \
DEF:States=pf_stats_db.rrd:States:MAX \
CDEF:scaled_States=States,1000,* \
AREA:BytesIn#33CC33:"bytes in " \
GPRINT:BytesIn:LAST:"Cur\:  %5.2lf" \
GPRINT:BytesIn:AVERAGE:"Avg\: %5.2lf" \
GPRINT:BytesIn:MAX:"Max\: %5.2lf" \
GPRINT:BytesIn:MIN:"Min\: %5.2lf\t\t" \
LINE1:scaled_States#FF0000:"states" \
GPRINT:States:LAST:"Cur\: %5.2lf" \
GPRINT:States:AVERAGE:"Avg\: %5.2lf" \
GPRINT:States:MAX:"Max\: %5.2lf" \
GPRINT:States:MIN:"Min\: %5.2lf\n" \
LINE1:BytesOut#0000CC:"bytes out" \
GPRINT:BytesOut:LAST:"Cur\: %5.2lf" \
GPRINT:BytesOut:AVERAGE:"Avg\: %5.2lf" \
GPRINT:BytesOut:MAX:"Max\: %5.2lf" \
GPRINT:BytesOut:MIN:"Min\: %5.2lf"

#####
######## pf packet rate graph
/usr/local/bin/rrdtool graph pf_stats_packets.png \
-w 785 -h 151 -a PNG \
--slope-mode \
--start -86400 --end now \
--font DEFAULT:7: \
--title "pf packet rate" \
--watermark "`date`" \
--vertical-label "pass packets/sec" \
--right-axis-label "block packets/sec" \
--right-axis 0.01:0 \
--right-axis-format %1.1lf \
--x-grid MINUTE:10:HOUR:1:MINUTE:120:0:%R \
--alt-y-grid --rigid \
DEF:PktsInPass=pf_stats_db.rrd:PktsInPass:MAX \
DEF:PktsOutPass=pf_stats_db.rrd:PktsOutPass:MAX \
DEF:PktsInBlock=pf_stats_db.rrd:PktsInBlock:MAX \
DEF:PktsOutBlock=pf_stats_db.rrd:PktsOutBlock:MAX \
CDEF:scaled_PktsInBlock=PktsInBlock,100,* \
CDEF:scaled_PktsOutBlock=PktsOutBlock,100,* \
AREA:PktsInPass#33CC33:"pass in " \
GPRINT:PktsInPass:LAST:"Cur\: %5.2lf" \
GPRINT:PktsInPass:AVERAGE:"Avg\: %5.2lf" \
GPRINT:PktsInPass:MAX:"Max\: %5.2lf" \
GPRINT:PktsInPass:MIN:"Min\: %5.2lf\t\t" \
LINE1:scaled_PktsInBlock#FF0000:"block in " \
GPRINT:PktsInBlock:LAST:"Cur\: %5.2lf" \
GPRINT:PktsInBlock:AVERAGE:"Avg\: %5.2lf" \
GPRINT:PktsInBlock:MAX:"Max\: %5.2lf" \
GPRINT:PktsInBlock:MIN:"Min\: %5.2lf\n" \
LINE1:PktsOutPass#0000CC:"pass out" \
GPRINT:PktsOutPass:LAST:"Cur\: %5.2lf" \
GPRINT:PktsOutPass:AVERAGE:"Avg\: %5.2lf" \
GPRINT:PktsOutPass:MAX:"Max\:  %5.2lf" \
GPRINT:PktsOutPass:MIN:"Min\: %5.2lf\t\t" \
LINE1:scaled_PktsOutBlock#FF8000:"block out" \
GPRINT:PktsOutBlock:LAST:"Cur\: %5.2lf" \
GPRINT:PktsOutBlock:AVERAGE:"Avg\: %5.2lf" \
GPRINT:PktsOutBlock:MAX:"Max\: %5.2lf" \
GPRINT:PktsOutBlock:MIN:"Min\: %5.2lf\t\t"

#####
######## pf state rate graph
/usr/local/bin/rrdtool graph pf_stats_states.png \
-w 785 -h 151 -a PNG \
--slope-mode \
--start -86400 --end now \
--font DEFAULT:7: \
--title "pf state rate" \
--watermark "`date`" \
--vertical-label "states/sec" \
--right-axis-label "searches/sec" \
--right-axis 100:0 \
--x-grid MINUTE:10:HOUR:1:MINUTE:120:0:%R \
--alt-y-grid --rigid \
DEF:StateInserts=pf_stats_db.rrd:StateInserts:MAX \
DEF:StateRemovals=pf_stats_db.rrd:StateRemovals:MAX \
DEF:StateSearchs=pf_stats_db.rrd:StateSearchs:MAX \
CDEF:scaled_StateSearchs=StateSearchs,0.01,* \
AREA:StateInserts#33CC33:"inserts" \
GPRINT:StateInserts:LAST:"Cur\: %5.2lf" \
GPRINT:StateInserts:AVERAGE:"Avg\: %5.2lf" \
GPRINT:StateInserts:MAX:"Max\: %5.2lf" \
GPRINT:StateInserts:MIN:"Min\: %5.2lf\t\t" \
LINE1:scaled_StateSearchs#FF0000:"searches" \
GPRINT:StateSearchs:LAST:"Cur\: %5.2lf" \
GPRINT:StateSearchs:AVERAGE:"Avg\: %5.2lf" \
GPRINT:StateSearchs:MAX:"Max\: %5.2lf" \
GPRINT:StateSearchs:MIN:"Min\: %5.2lf\n" \
LINE1:StateRemovals#0000CC:"removal" \
GPRINT:StateRemovals:LAST:"Cur\: %5.2lf" \
GPRINT:StateRemovals:AVERAGE:"Avg\: %5.2lf" \
GPRINT:StateRemovals:MAX:"Max\: %5.2lf" \
GPRINT:StateRemovals:MIN:"Min\: %5.2lf"

####### copy to the web directory
cp pf_stats_*.png /var/www/htdocs/
This example will continue to collect data every minute in accordance the step 60 we specified in the database. The create_graph.sh script will run on the 1st and 31st minute of the hour between the hours of 10am and 10pm (22:00).
user@machine# crontab -e
#minute (0-59)
#|   hour (0-23)
#|   |     day of the month (1-31)
#|   |     |    month of the year (1-12)
#|   |     |    |   day of the week (0-6 with 0=Sun)
#|   |     |    |   |   commands
#|   |     |    |   |   |
#### rrdtool pf firewall statistics
*    *     *    *   *   /tools/rrdtool/pf_stat/update_rrd_database.sh
1,31 10-22 *    *   *   /tools/rrdtool/pf_stat/create_graph.sh >> /dev/null 2>&1
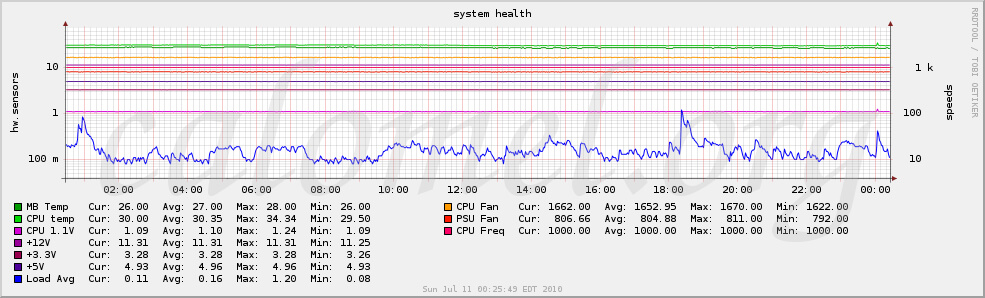
Explaining the graph. Here are are graphing the general system health of an OpenBSD machine. The bottom lower left of the picture shows the legend for the data scaled on the left hand side of the graph. The left side vertical legend specifies this data is hw.sensors. The right hand side of the graph shows the cpu, psu and fan speeds scaled to fit on the same graph. There is a lot of data on the graph, but what we are looking for is patterns deviating from normal. If we see any of the colored horizontal lines spike then we know to take a look at what happened and why. For example, notice at 14:00 on the graph a spike in cpu speed (light green), cpu frequency (red) and system load (blue). This was due to a job that was running to compile statistics from the logs.
The title is in black at the top and at the bottom in a watermark (light gray) is the date and time the graph was created. When reading the graph remember that new data is on the right and the oldest data is on the left. The "calomel.org" watermark is not part of rrdtool and just used to identify our site.
Working directory. Put all of the files into a working directory called, "/tools/rrdtool/health/". This is where the three(3) scripts, the database and the graph will reside. Once the graph is made it can be copied to a web directory like, "/var/www/htdocs/".
The following scrollable window contains the command we used to make the rrd file. Cut and paste the script into a file called, "initialize_database.sh" and make it executable with "chmod 755 update_rrd_database.sh". The rrdtool lines in the file are one command, but we have put line breaks ( \ is a line break ) in to create multiple lines so it is easier to read and explain.
user@machine# cat initialize_database.sh

### change to the script directory
cd /tools/rrdtool/health/

rrdtool create health_db.rrd \
--step 60 \
DS:MbTemp:GAUGE:120:0:10000000000000 \
DS:CpuTemp:GAUGE:120:0:10000000000000 \
DS:CpuFan:GAUGE:120:0:10000000000000 \
DS:PSFan:GAUGE:120:0:10000000000000 \
DS:VCore:GAUGE:120:0:10000000000000 \
DS:Plus12V:GAUGE:120:0:10000000000000 \
DS:Plus3V:GAUGE:120:0:10000000000000 \
DS:Plus5V:GAUGE:120:0:10000000000000 \
DS:Neg12V:GAUGE:120:0:10000000000000 \
DS:CpuSpeed:GAUGE:120:0:10000000000000 \
DS:LoadAvg:GAUGE:120:0:10000000000000 \
RRA:MAX:0.5:1:1500
This is a shell script to collect the data from the "sysctl" command. Before using this script make sure the paths at the top of the script match the paths on your system. These paths are for the latest release of OpenBSD.
user@machine# cat update_rrd_database.sh

#!/usr/local/bin/bash

gawk="/usr/local/bin/gawk"
sysctl="/sbin/sysctl"
rrdtool="/usr/local/bin/rrdtool"

health_info() {
    local output=$($sysctl 2>&1)
    local temp=$(echo "$output" | $gawk '
        BEGIN {MbTemp=0; CpuTemp=0; CpuFan=0; PSFan=0; \
               VCore=0; Plus12V=0; Plus3V=0; Plus5V=0; \
               Neg12V=0; CpuSpeed=0}
        {FS = "[= ]"}
        /hw.sensors.lm1.temp0/ {MbTemp = $2 }
        /hw.sensors.lm1.temp1/ { CpuTemp = $2 }
        /hw.sensors.lm1.fan1/ { CpuFan = $2 }
        /hw.sensors.lm1.fan2/ { PSFan = $2 }
        /hw.sensors.lm1.volt0/ { VCore = $2 }
        /hw.sensors.lm1.volt1/ { Plus12V = $2 }
        /hw.sensors.lm1.volt2/ { Plus3V = $2 }
        /hw.sensors.lm1.volt3/ { Plus5V = $2 }
        /hw.sensors.lm1.volt4/ { Neg12V = $2 }
        /hw.cpuspeed/ { CpuSpeed = $2 }
        /vm.loadavg/ { LoadAvg = $3 }
        END {print MbTemp ":" CpuTemp ":" CpuFan ":" PSFan ":" VCore ":" Plus12V ":" Plus3V ":" Plus5V ":" Neg12V ":" CpuSpeed ":" LoadAvg }
        ')
    RETURN_VALUE=$temp
}

### change to the script directory
cd /tools/rrdtool/health/

### collect the data
health_info

### update the database
$rrdtool update health_db.rrd --template MbTemp:CpuTemp:CpuFan:PSFan:VCore:Plus12V:Plus3V:Plus5V:Neg12V:CpuSpeed:LoadAvg N:$RETURN_VALUE
After you have the cron job running for ten minutes or so you should have enough data to see on the graph. A cron job example is at the bottom of this example. Copy and paste the following script we call "create_graph.sh" and make it executable with "chmod 755 create_graph.sh".
user@machine# cat create_graph.sh

### change to the script directory
cd /tools/rrdtool/health/

## Graph for last 24 hours
/usr/local/bin/rrdtool graph health_of_system.png \
-w 785 -h 151 -a PNG \
--slope-mode \
--logarithmic --units=si \
--start end-86400 --end now \
--font DEFAULT:7: \
--title "system health" \
--watermark "`date`" \
--vertical-label "hw.sensors" \
--right-axis-label "speeds" \
--right-axis 100:0 \
--x-grid MINUTE:10:HOUR:1:MINUTE:120:0:%R \
--alt-y-grid --rigid \
DEF:MbTemp=health_db.rrd:MbTemp:MAX \
DEF:CpuTemp=health_db.rrd:CpuTemp:MAX \
DEF:CpuFan=health_db.rrd:CpuFan:MAX \
DEF:PSFan=health_db.rrd:PSFan:MAX \
DEF:VCore=health_db.rrd:VCore:MAX \
DEF:Plus12V=health_db.rrd:Plus12V:MAX \
DEF:Plus3V=health_db.rrd:Plus3V:MAX \
DEF:Plus5V=health_db.rrd:Plus5V:MAX \
DEF:Neg12V=health_db.rrd:Neg12V:MAX \
DEF:CpuSpeed=health_db.rrd:CpuSpeed:MAX \
DEF:LoadAvg=health_db.rrd:LoadAvg:MAX \
CDEF:scaled_CpuFan=CpuFan,0.01,* \
CDEF:scaled_PSFan=PSFan,0.01,* \
CDEF:scaled_CpuSpeed=CpuSpeed,0.01,* \
LINE1:MbTemp#009900:"MB Temp " \
GPRINT:MbTemp:LAST:"Cur\: %5.2lf" \
GPRINT:MbTemp:AVERAGE:"Avg\: %5.2lf" \
GPRINT:MbTemp:MAX:"Max\: %5.2lf" \
GPRINT:MbTemp:MIN:"Min\: %5.2lf\t\t" \
LINE1:scaled_CpuFan#FF9900:"CPU Fan " \
GPRINT:CpuFan:LAST:"Cur\: %5.2lf" \
GPRINT:CpuFan:AVERAGE:"Avg\: %5.2lf" \
GPRINT:CpuFan:MAX:"Max\: %5.2lf" \
GPRINT:CpuFan:MIN:"Min\: %5.2lf\n" \
LINE1:CpuTemp#00D600:"CPU temp" \
GPRINT:CpuTemp:LAST:"Cur\: %5.2lf" \
GPRINT:CpuTemp:AVERAGE:"Avg\: %5.2lf" \
GPRINT:CpuTemp:MAX:"Max\: %5.2lf" \
GPRINT:CpuTemp:MIN:"Min\: %5.2lf\t\t" \
LINE1:scaled_PSFan#FF1A00:"PSU Fan " \
GPRINT:PSFan:LAST:"Cur\:  %5.2lf" \
GPRINT:PSFan:AVERAGE:"Avg\:  %5.2lf" \
GPRINT:PSFan:MAX:"Max\:  %5.2lf" \
GPRINT:PSFan:MIN:"Min\:  %5.2lf\n" \
LINE1:VCore#D600D6:"CPU 1.1V" \
GPRINT:VCore:LAST:"Cur\: %5.2lf" \
GPRINT:VCore:AVERAGE:"Avg\: %5.2lf" \
GPRINT:VCore:MAX:"Max\: %5.2lf" \
GPRINT:VCore:MIN:"Min\: %5.2lf\t\t" \
LINE1:scaled_CpuSpeed#FF0066:"CPU Freq" \
GPRINT:CpuSpeed:LAST:"Cur\: %5.2lf" \
GPRINT:CpuSpeed:AVERAGE:"Avg\: %5.2lf" \
GPRINT:CpuSpeed:MAX:"Max\: %5.2lf" \
GPRINT:CpuSpeed:MIN:"Min\: %5.2lf\n" \
LINE1:Plus12V#990099:"+12V    " \
GPRINT:Plus12V:LAST:"Cur\: %5.2lf" \
GPRINT:Plus12V:AVERAGE:"Avg\: %5.2lf" \
GPRINT:Plus12V:MAX:"Max\: %5.2lf" \
GPRINT:Plus12V:MIN:"Min\: %5.2lf\n" \
LINE1:Plus3V#99004D:"+3.3V   " \
GPRINT:Plus3V:LAST:"Cur\: %5.2lf" \
GPRINT:Plus3V:AVERAGE:"Avg\: %5.2lf" \
GPRINT:Plus3V:MAX:"Max\: %5.2lf" \
GPRINT:Plus3V:MIN:"Min\: %5.2lf\n" \
LINE1:Plus5V#4D0099:"+5V     " \
GPRINT:Plus5V:LAST:"Cur\: %5.2lf" \
GPRINT:Plus5V:AVERAGE:"Avg\: %5.2lf" \
GPRINT:Plus5V:MAX:"Max\: %5.2lf" \
GPRINT:Plus5V:MIN:"Min\: %5.2lf\n" \
LINE1:Neg12V#330066:"-12V    " \
GPRINT:Neg12V:LAST:"Cur\: %5.2lf" \
GPRINT:Neg12V:AVERAGE:"Avg\: %5.2lf" \
GPRINT:Neg12V:MAX:"Max\: %5.2lf" \
GPRINT:Neg12V:MIN:"Min\: %5.2lf\n" \
LINE1:LoadAvg#0000FF:"Load Avg" \
GPRINT:LoadAvg:LAST:"Cur\: %5.2lf" \
GPRINT:LoadAvg:AVERAGE:"Avg\: %5.2lf" \
GPRINT:LoadAvg:MAX:"Max\: %5.2lf" \
GPRINT:LoadAvg:MIN:"Min\: %5.2lf\n" \

## copy to the web directory
cp health_*.png /var/www/htdocs/
This example will continue to collect data every minute. The create_graph.sh script will run on the 1st and 31st minute of the hour between the hours of 10am and 10pm (22:00).
user@machine# crontab -e
#minute (0-59)
#|   hour (0-23)
#|   |     day of the month (1-31)
#|   |     |    month of the year (1-12)
#|   |     |    |   day of the week (0-6 with 0=Sun)
#|   |     |    |   |   commands
#|   |     |    |   |   |
#### rrdtool latency check
*    *     *    *   *   /tools/rrdtool/health/update_rrd_database.sh
1,31 10-22 *    *   *   /tools/rrdtool/health/create_graph.sh >> /dev/null 2>&1
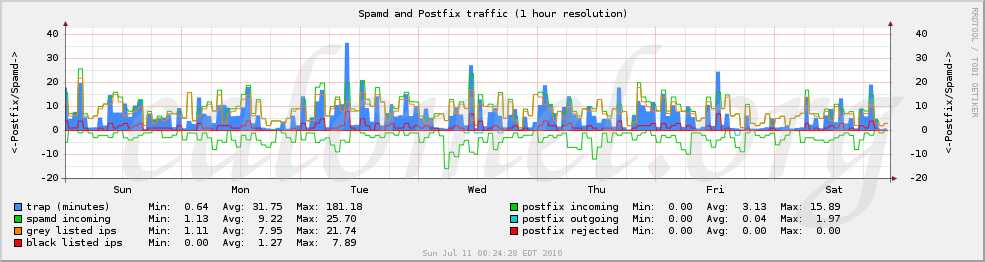
Explaining the graph. This graph shows SMTP traffic as reported by both OpenBSD's Spamd and Postfix. The vertical center line of the graph is zero; positive values are data collected from Spamdb and negative data is Postfix. Data is collected every hour and this explains why the graph looks more "step like" compared to our other examples. The blue area fill is the amount of time spamd has trapped spammers. The other colors are lines and defined clearly in the legend. The title is in black at the top and at the bottom in a watermark (light gray) is the date and time the graph was created. When reading the graph remember that new data is on the right and the oldest data is on the left. The "calomel.org" watermark is not part of rrdtool and just used to identify our site.
Working directory. Put all of the files into a working directory called, "/tools/rrdtool/spamdb/". This is where the three(3) scripts, the database and the graph will reside. Once the graph is made it can be copied to a web directory like, "/var/www/htdocs/".
The following scrollable window contains the command we used to make the rrd file. Cut and paste the script into a file called, "initialize_database.sh" and make it executable with "chmod 755 update_rrd_database.sh". The rrdtool lines in the file are one command, but we have put line breaks ( \ is a line break ) in to create multiple lines so it is easier to read and explain.
user@machine# cat initialize_database.sh

### change to the script directory
cd /tools/rrdtool/spamdb/

rrdtool create spamdb_db.rrd \
--step 3600 \
DS:SpamdTime:GAUGE:7200:0:10000000 \
DS:SpamdConn:GAUGE:7200:0:10000000 \
DS:SpamdGrey:GAUGE:7200:0:10000000 \
DS:SpamdBlack:GAUGE:7200:0:10000000 \
DS:PostfixConnIn:GAUGE:7200:0:10000000 \
DS:PostfixConnOut:GAUGE:7200:0:10000000 \
DS:PostfixRejected:GAUGE:7200:0:10000000 \
RRA:MAX:0.5:1:1500 \
This is a shell script to collect the data from the daemon and maillog logs. Before using this script make sure the paths at the top of the script match the paths on your system. These paths are for the latest release of OpenBSD.
user@machine# cat update_rrd_database.sh

#!/usr/local/bin/bash

### collect the data
rrdtool="/usr/local/bin/rrdtool"
current_hour=`date "+%b %e %H"`
spamdb_output="`cat /var/log/daemon | grep \"$current_hour\"`"
postfix_output="`cat /var/log/maillog | grep \"$current_hour\"`"
SpamdTime=$(echo "$spamdb_output" | grep disconnected | awk '{s += $9} END {print s/60}')
SpamdConn=$(echo "$spamdb_output" | grep -c disconnected)
SpamdGrey=$(echo "$spamdb_output" | grep disconnected | grep -vc spamd-greytrap)
SpamdBlack=$(echo "$spamdb_output" | grep disconnected | grep -c spamd-greytrap)
PostfixConnIn=$(echo "$postfix_output" | grep -c relay=local)
PostfixConnOut=$(echo "$postfix_output" | grep relay | grep -vc local)
PostfixRejected=$(echo "$postfix_output" | grep -c rejected)
RETURN_VALUE=$SpamdTime:$SpamdConn:$SpamdGrey:$SpamdBlack:$PostfixConnIn:$PostfixConnOut:$PostfixRejected

### change to the script directory
cd /tools/rrdtool/spamdb/

### update the database
$rrdtool update spamdb_db.rrd --template SpamdTime:SpamdConn:SpamdGrey:SpamdBlack:PostfixConnIn:PostfixConnOut:PostfixRejected N:$RETURN_VALUE
After you have the cron job running for a few hours you should have enough data to see on the graph. A cron job example is at the bottom of this example. Copy and paste the following script we call "create_graph.sh" and make it executable with "chmod 755 create_graph.sh".
user@machine# cat create_graph.sh

### change to the script directory
cd /tools/rrdtool/spamdb/

## SMTP graph
/usr/local/bin/rrdtool graph spamdb_graph.png \
-w 785 -h 120 -a PNG \
--slope-mode \
--start -604800 --end -3600 \
--font DEFAULT:7: \
--title "smtp traffic (1 hour resolution)" \
--watermark "`date`" \
--vertical-label ">-Postfix/Spamd->" \
--right-axis-label ">-Postfix/Spamd->" \
--right-axis 1:0 \
--alt-y-grid --rigid \
DEF:SpamdTime=spamdb_db.rrd:SpamdTime:MAX \
DEF:SpamdConn=spamdb_db.rrd:SpamdConn:MAX \
DEF:SpamdGrey=spamdb_db.rrd:SpamdGrey:MAX \
DEF:SpamdBlack=spamdb_db.rrd:SpamdBlack:MAX \
DEF:PostfixConnIn=spamdb_db.rrd:PostfixConnIn:MAX \
DEF:PostfixConnOut=spamdb_db.rrd:PostfixConnOut:MAX \
DEF:PostfixRejected=spamdb_db.rrd:PostfixRejected:MAX \
CDEF:scaled_SpamdTime=SpamdTime,0.1,* \
CDEF:neg_PostfixConnIn=PostfixConnIn,-1,* \
CDEF:neg_PostfixConnOut=PostfixConnOut,-1,* \
CDEF:neg_PostfixRejected=PostfixRejected,-1,* \
AREA:scaled_SpamdTime#3D8BFF:"trap (minutes)\t" \
GPRINT:SpamdTime:MIN:"Min\: %5.2lf" \
GPRINT:SpamdTime:AVERAGE:"Avg\: %5.2lf" \
GPRINT:SpamdTime:MAX:"Max\: %5.2lf\t\t\t\t" \
LINE1:neg_PostfixConnIn#00CC00:"postfix incoming" \
GPRINT:PostfixConnIn:MIN:"Min\: %5.2lf" \
GPRINT:PostfixConnIn:AVERAGE:"Avg\: %5.2lf" \
GPRINT:PostfixConnIn:MAX:"Max\: %5.2lf\n" \
LINE1:SpamdConn#00CC00:"spamd incoming\t" \
GPRINT:SpamdConn:MIN:"Min\: %5.2lf" \
GPRINT:SpamdConn:AVERAGE:"Avg\: %5.2lf" \
GPRINT:SpamdConn:MAX:"Max\: %5.2lf\t\t\t\t" \
LINE1:neg_PostfixConnOut#00CCCC:"postfix outgoing" \
GPRINT:PostfixConnOut:MIN:"Min\: %5.2lf" \
GPRINT:PostfixConnOut:AVERAGE:"Avg\: %5.2lf" \
GPRINT:PostfixConnOut:MAX:"Max\: %5.2lf\n" \
LINE1:SpamdGrey#FF8000:"grey listed ips\t" \
GPRINT:SpamdGrey:MIN:"Min\: %5.2lf" \
GPRINT:SpamdGrey:AVERAGE:"Avg\: %5.2lf" \
GPRINT:SpamdGrey:MAX:"Max\: %5.2lf\t\t\t\t" \
LINE1:neg_PostfixRejected#FF0000:"postfix rejected" \
GPRINT:PostfixRejected:MIN:"Min\: %5.2lf" \
GPRINT:PostfixRejected:AVERAGE:"Avg\: %5.2lf" \
GPRINT:PostfixRejected:MAX:"Max\: %5.2lf\n" \
LINE1:SpamdBlack#FF0000:"black listed ips\t" \
GPRINT:SpamdBlack:MIN:"Min\: %5.2lf" \
GPRINT:SpamdBlack:AVERAGE:"Avg\: %5.2lf" \
GPRINT:SpamdBlack:MAX:"Max\: %5.2lf" \

## copy to the web directory
cp spamdb_graph.png /var/www/htdocs/
This example will continue to collect data every hour on the 59th minute. The create_graph.sh script will run on the 1st and 31st minute of the hour between the hours of 10am and 10pm (22:00).
user@machine# crontab -e
#minute (0-59)
#|   hour (0-23)
#|   |     day of the month (1-31)
#|   |     |    month of the year (1-12)
#|   |     |    |   day of the week (0-6 with 0=Sun)
#|   |     |    |   |   commands
#|   |     |    |   |   |
#### rrdtool latency check
59   *     *    *   *   /tools/rrdtool/spamdb/update_rrd_database.sh
1,31 10-22 *    *   *   /tools/rrdtool/spamdb/create_graph.sh >> /dev/null 2>&1
How long does RRDtool take to make a graph ?All of the graphs on this page take less than a second each to create. The update of the database also takes less than a second.